
 The alligator strategy is a strategy that can be used in the money
market / capital market. In this text
referring to the Forex market.
The alligator strategy is a strategy that can be used in the money
market / capital market. In this text
referring to the Forex market.
The alligator strategy consists of an alligator that eat and sleep.
When the alligator is a sleep the mouth of the alligator is close and the currency rate is falling. Vice versa when the alligator is awake the mouth of the alligator is open. In other words the alligator is ready to eat and the currency rate curve is rising.
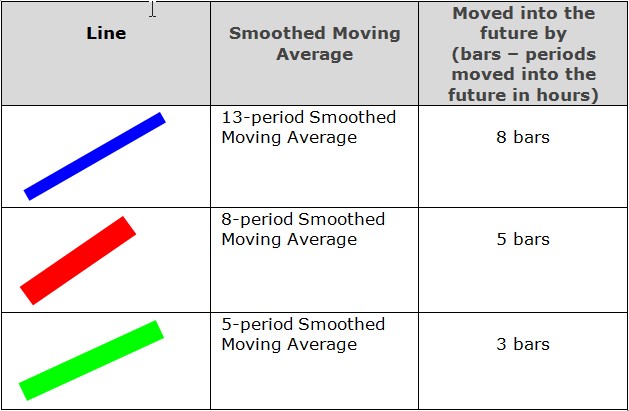
The Forex trading strategy consists of the alligator’s chaps teethes and lips. The chaps, teethes and lips are represented in the currency rate curve as three lines. The blue line is the alligator’s chap, the red line is the alligator’s teethes and the green line is the alligator’s lips.
The lines represent the following values
The alligator strategy illustrated in a graph
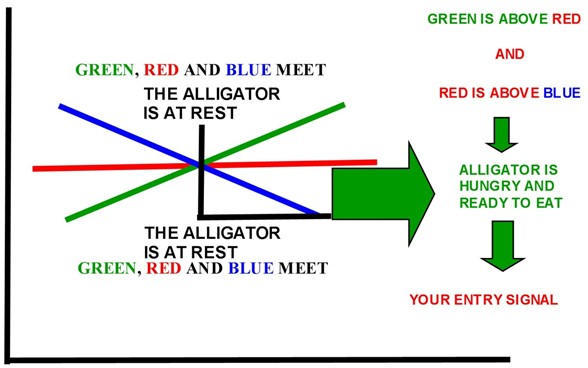
In the graph is the alligator trading strategy illustrated. The graph illustrate when the alligator is ready to eat. In other words the trader’s entry signal is given and they are ready to trade the currency they are interested in as the USD/EUR or USD/JYP etc.
Just to have an overview of the alligator strategy the table below explains what the lines position indicates. The table is made the way the lines are represented in a graph. The lines position in a graph is similar to the position in the table.
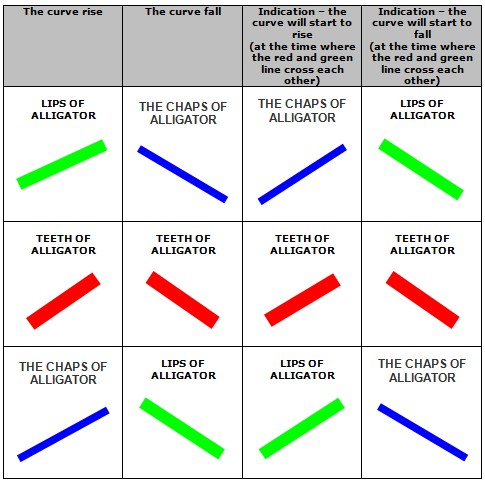
If the curve rise the green line will be the highest curve, the red line the next highest curve and the blue line the lowest curve. If the curve falls the blue line will be the highest line, the red line the next highest line and the green line the lowest line.
If the red and green line crosses each other there is an indication that there is a change in the curve. If the curve is falling or rising depend on the blue line. If the blue line is the highest line there is an indication that the curve is rising and reverses if the blue line is the lowest there is an indication that the curve is falling.
If there is an indication that that the curve will fall the blue line will be the highest line, the red line the next highest line and the green line the lowest line.
If there is an indication that the curve will rise the green line will be the highest curve, the red line the next highest curve and the blue line the lowest curve.
Some comments about the lines
When a change in the lines starts the green line starts to change first then the red line and last the blue line. The gap between the green and the red line indicate if the curve is continuing rising or falling. The bigger the gap is the stronger is the indication that the curve is continuing rising or falling.
At the trading platform PLUS500 is the alligator function in the F(X) button just above the graph.
